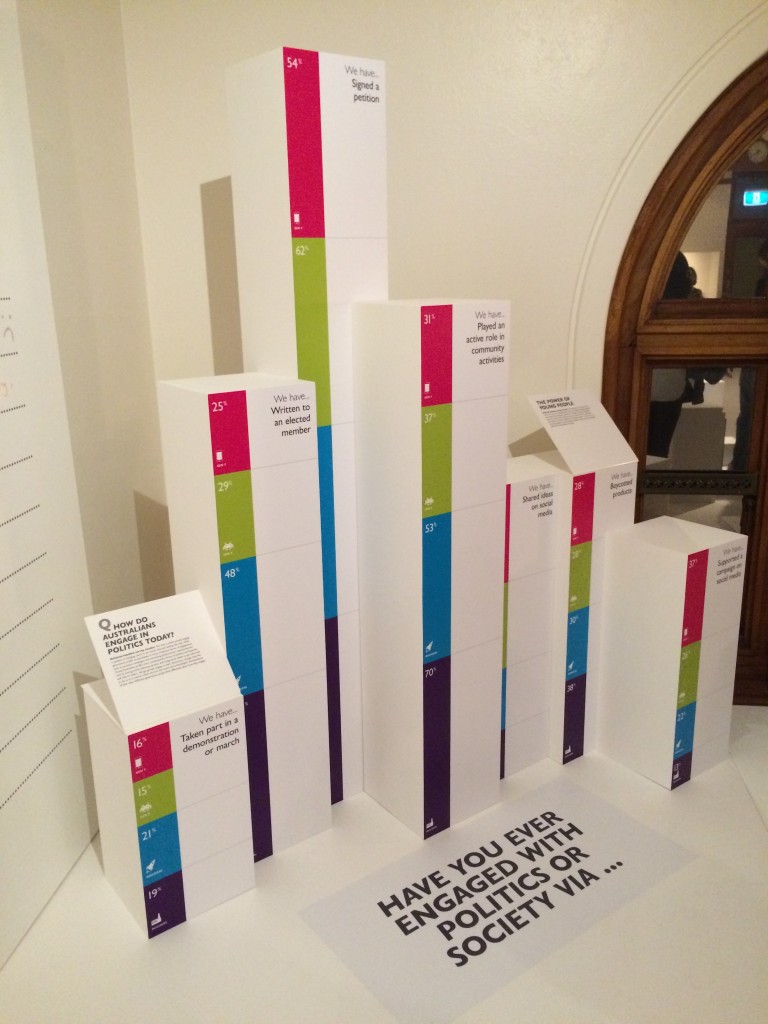
“The Power of 1 Voice” is an amazing multi-platform production on the topic of Australian democracy. The project comes from the folks at the Museum of Australian Democracy (MOAD) and their fine cast of partners. Through the University of Canberra’s Digital Treasures program, I was able to work with colleague Mitchell Whitelaw on one component of the Power of 1 project; a tangible data visualisation.
Power of 1 is fundamentally a conversation about Australian democracy and a centrepiece of the production is a large survey representing 4 generations’ views. MOAD wanted to use the physical exhibition at Old Parliament House as a way to share some of the survey data, as well as keep the conversation going through inventive installation interfaces produced by the clever crew at ModProds. For Mitchell and I, the task was to consider the data within the exhibition space, and from the outset there was strong consensus on using physical representations rather than screens or projections. An excellent screen-based representation was produced by Small Multiples for SBS, so the on-site installation needed to provide a very different perspective of the survey results. Our aim was to provide a way for an audience to get up close and personal with the data – to literally get amongst it.


The outcome, pictured above, is a landscape of “data columns” with each column representing a particular survey proposition and the coloured segments indicating the response according to generation; Builders (1925-45), Baby-Boomers (1946-64), Gen-X (1965-79), and Gen-Y (1980-94). The clusters of columns are grouped according to a particular theme or question. In the above example the columns relate to the question “Have you ever engaged with politics or society via…”.
The work makes clear reference to the column graph and the ballot box, both essential elements of the project. The columns are simple devices, yet their scale and tangibility offer a novel way to experience the survey data. The emphasis here is not only on a reading of the data but an understanding which is phenomenological. I can connect our approach to Pragmatist notions of aesthetics (phenomenological, emergent, situated) but more simply our proposition is that walking amongst a set of data provides a very different knowing to that gained from reading a chart on a page or computer screen.
Our work was inspired by some other excellent examples of tangible / physical data representations including: Sagmeister & Walsh’s “Happy Show“, Abigail Reynolds’ “Mount Fear“, and Sha Hwang & Rachel Binx’s “Meshu“.


The American Museum of Natural History’s “Scales of the Universe” exhibit is also worth a mention; a wonderful example of how the sheer physicality of an installation can dramatically influence an audience’s appreciation of abstract data.
The data columns are gathered together in the “Generations Room”; a site representing an overview of the survey and featuring a number of interfaces (analogue & digital) for audience members to participate and share their views. In addition to the Generations Room, the exhibition consists of a custom installation for each of the 4 demographic groups, each themed accordingly and offering a unique mode for participating in the ongoing conversation about Australian democracy. The exhibition installations and the tech behind them have been artfully realised by ModProds.
It was a real privilege to be invited to contribute to the Power of 1 and to work with the fascinating dataset the production has generated. Tangible/non-screen data representations are something Mitchell and I have delved into previously (see for example Virga and Measuring Cup) and will continue to explore. It’s an area I see increasing in importance, particularly in the public sphere. The flat-screen (large and small) will continue to be a ubiquitous tool for data representation but there is great opportunity (and need) for alternative ways to bring data into public spaces.