3D

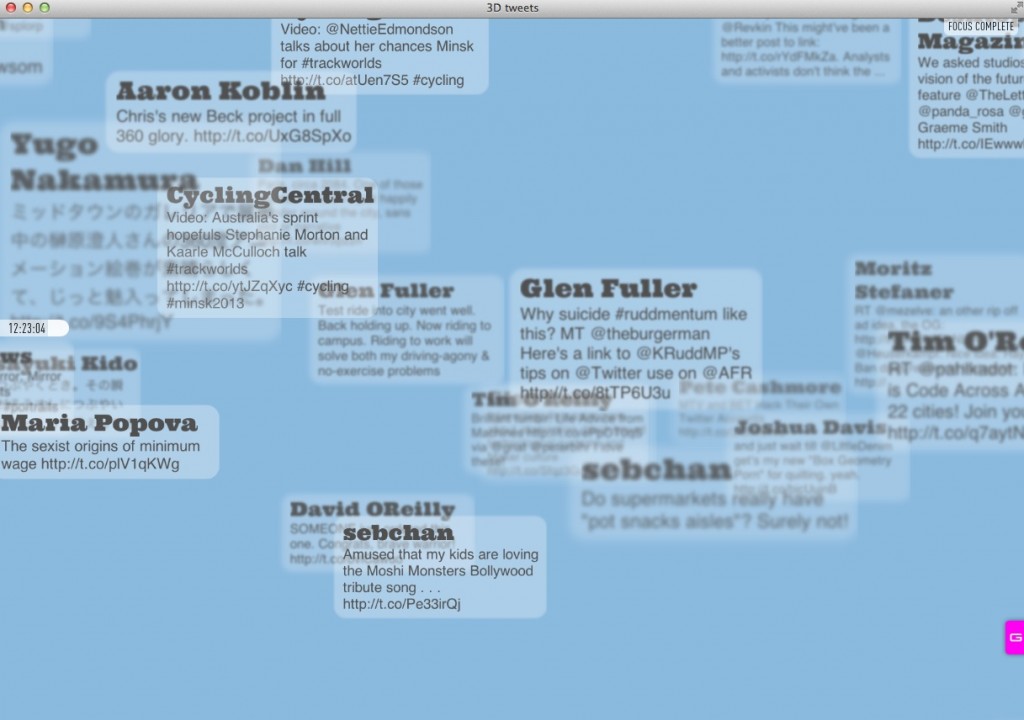
In this work, the tweet stream is represented in a virtual 3D space with older tweets in the far distance and more recent tweets in the near distance. While the piece has some practical logic governing its arrangement, its primary aim is one of affect, creating an atmosphere in which the viewer floats amongst their tweet stream. It is most effective at closer proximity, where the sense of scale and depth of field becomes exaggerated. It presents an ambient form of browsing where tweets are discovered by chance as they float into view. The overlapping and blurring of tweets gives a sense of a cacophony of voices rather than the tidy timeline that is the norm of Twitter clients.
3D tweets
Tweets in space

Double clicking on a tweet shifts the focus and zooms the view to its proximity. Double clicking in space resets the view. Single clicking a tweet highlights it and others by the author. Clicking the time marker on the left of the screen reveals a histogram of the tweet stream. Dragging the time marker to a new position changes the focal depth to the tweets within the chosen time band.

The main 3D effect (scaling and parallax scrolling) comes courtesy of CSS 3D transforms and the depth of field is achieved using CSS text-shadow and box-shadow. The fill of the text and boxes is transparent, their form being made entirely of the CSS shadow. The level of shadow is determined by the Z-depth of the element relative to the current focal depth. The CSS is along the lines of:

color: rgba(0,0,0,0); text-shadow: 0 0 2px rgba(0,0,0,0.75);

In the above CSS, the text’s color attribute is set to transparent. Its text-shadow has no x and y offset, 2 pixels of blur and the shadow’s colour is set to black (0,0,0) with transparency of 0.75.

Example: 1 pixel blur, 2 pixel blur, 3 pixel blur, 4 pixel blur.

While the rendering of the general 3D effect (scaling and parallax) is really impressive (even on mobile devices) re-rendering the blur of elements is much slower and there is a noticeable delay each time the depth of field is adjusted. There’s no denying that it’s a crude technique but until depth of field is included in CSS 3D transforms it serves as an easy hack for simulating depth of field for text and simple shapes. For a bit of comparison, here is an early sketch using Flash and the Papervision 3D library for rendering.

http://gravitron.com.au/3d/flash/sketch/3d.swf

The sketch uses a small sample of cached tweets (from some years back) and does not interact with the live Twitter API. Clicking a tweet once zooms to its proximity. Clicking the tweet a second time resets the zoom. Despite obvious differences between the Flash/Actionscript and html/css/js contexts, the Flash version works in a very similar way to the html native version. As with the css version, the depth of field blurring is based on the z-index of the element relative to the current focal depth. The obvious difference is that the focal depth is adjusted dynamically on the rollover of elements. This is an effect that is only possible in the css version with a very limited number of elements. The Flash sketch also slows with the addition of more elements but it manages pretty capably with the selection of tweets included.


SOFT INDUCTION

Within the CSS language there is increasing reference to properties of time and space in rules for 3D transforms, animation, and transitions. From a graphic design perspective it’s evidence of how design and layout concepts borrowed from print are evolving in response to the computational context. I say “computational context” rather than “screen” because the changes are about much more than a shift from dots to pixels. In addition to references to time and space there is also an increasing incidence of computational concepts and techniques. For example, CSS already has limited support for variables which allow programmatic assignment of values for colour, size, etc.

For some, like the creative code scene, the engagement with computation is explicit and sees designers employing programming languages like Java and C++ using tools like Processing and openFrameworks. But the evolution of CSS points to a more subtle permeation of computational concepts and techniques, and a softer induction of designers into computational/programmatic practices. For example, even a simple concept like using CSS media-queries for different device widths represents a form of programmatic design. And once familiar with elementary programmatic concepts a curious designer can scaffold to more sophisticated computational concepts and techniques, and fully featured programming languages. More simply, I’m describing a “top-down” rather than “bottom-up” approach to programming – designers developing programmatic techniques through familiar tools and technologies rather than approaching programming as a foreign language to learn.

At this juncture it’s very tempting to segue into a discussion of Minecraft, and how it manages to gently induct kids into a broad range of computer activities well outside the bounds of its virtual 3D world… But, instead I’ll save that for a separate spiel and leave this at that.

Links: http://gravitron.com.au/3d
Tweet Report

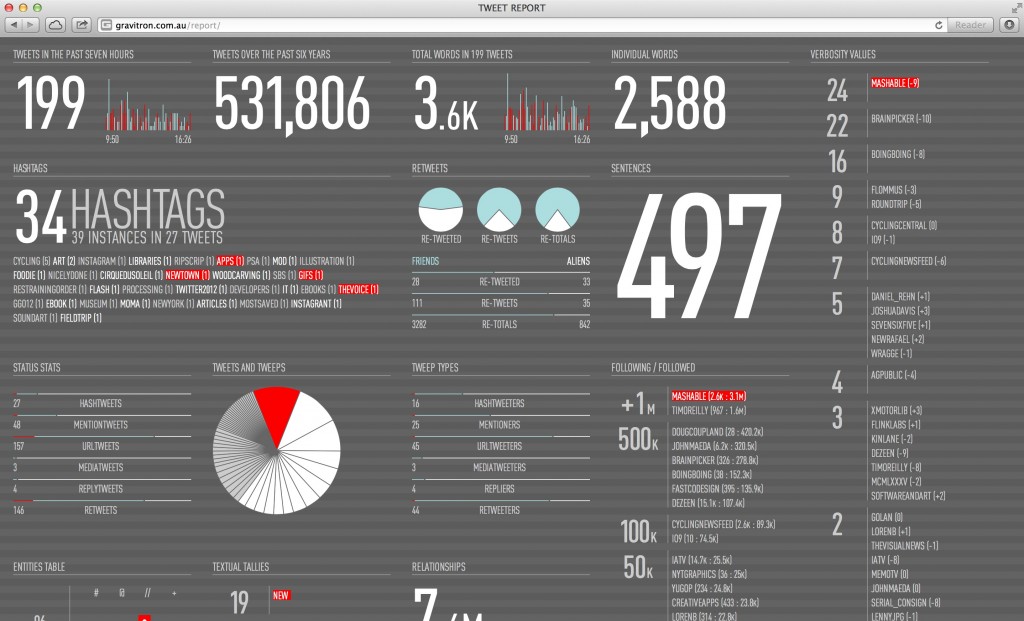
Tweet Report takes a twitter stream and renders it as an interactive infographic poster. Instead of the usual focus on the textual content of tweets, the Tweet Report treats the entire tweet stream as a dataset. Looking at an example of the json data that the Twitter API delivers, it is apparent that it already contains various classifications and values: statuses count, friends count, followers count, created date, etc. In addition to using these existing values, the Tweet Report performs a significant amount of data processing of the json object, creating totals for things like hashtags, mentions, retweets, replies, etc, and recording relationships between totals and those who contributed to them.

With its infographic aesthetic, is particularly inspired by the work of Nicholas Felton whose “Feltron Annual Reports” are seminal works in the data graphics field. The Feltron Reports present the minutia of Felton’s daily life as beautifully crafted info-graphic posters. My Tweet Report draws some obvious cues from Felton’s work and shares his focus on quantifying the unlikely and overlooked.

While at first it presents as a static poster, the Tweet Report is an interactive work that rewards the inquisitive reader. Clicking different elements reveals their relationships to other elements within the polls, charts and lists.

Tweet Report
The red highlighting indicates the relationships between different items.

Attributes such as author, time, words, hashtags and links can all be used as keys. Once clicked, the Report uses CSS classes to target related elements within a group. The resulting index of CSS classes is quite complex but remarkably the HTML DOM manages it without issue. Using jQuery to highlight a group of elements via their CSS class is typically achieved like so:

$('.target_css_class').css('background-color', 'red');

However, jQuery cannot target SVG elements (such as the slices in a pie chart, or lines on a graph) via their CSS class. As a work-around I use temporary global CSS styles – adding a style to the head of the html document, adding styling attributes for a particular class and letting the browser do the highlighting work on both HTML and SVG elements. For example:

$('head').append('<style type="text/css" id="highlightStyles"></style>');
$('#highlightStyles').append('.target_css_class { background-color: red; }');


G R I D S

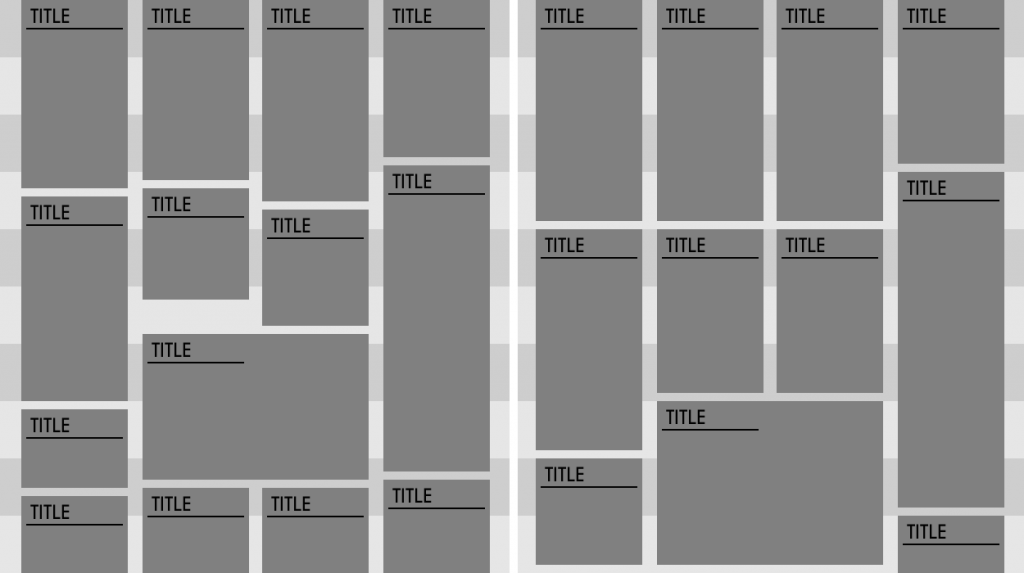
In addition to a typical horizontal column structure, the layout also employs a vertical grid. Implementing the vertical grid requires additional processing as standard CSS does not currently address modular vertical spacing. The default elastic boxes of the DOM expand as required unless given specific width/height values, resulting in ragged alignment across columns. In the case of a vertical grid we need to maintain elasticity to accommodate content but want to step any expansion to a minimum line-height value, avoiding the ragged vertical alignment across columns.

Vertical Grid
On the left, the height of each element is based on its content. On the right, the height of each element is conformed to a regular line-height.

The content is rendered to the DOM as per the illustration to the left. A script then checks the height of each element and normalises it to a set line-height increment, as per the illustration to the right. So, if the line height is 25 pixels, height 19 becomes 25, height 32 becomes 50, height 71 becomes 75, etc. You can also see the vertical grid at work in GRIDS.


SYSTEMS

Programming the vertical grid is just one example of computationally codifying graphic design conventions – looking for the patterns and formulas embedded within graphic artefacts and design processes and automating them with computer code. There are many examples of programmatic, systemised approaches in “traditional” graphic design (which I write about elsewhere in these Notes). For example, Gerstner’s 1964 book “Designing Programmes” describes programmatic approaches to design and layout. Tschichold was another pioneer of systemised design, with the Penguin Classics epitomising his approach (see Twitter Modern Classics).

Designing Programmes spread
A spread from “Designing Programmes” (www.thinkingform.com)

My point here is that graphic design has a rich tradition in systemised design approaches which are ideally suited to the computational context. By connecting with those traditions we can learn a great deal but also negate common print versus screen tensions. While I’m personally excited by notions of computational design, I don’t mean to suggest that imagination, expertise and aesthetic judgement can all be computationally codified – but I do think there is value in attempting to understand the rules inherent in design practices. Close examination of design practices can reveal implicit programmatic processes which we can then attempt to automate in the computer context. If all of this makes you feel paranoid that some software will soon be doing your design work, I think it’s worth highlighting that analysing traditional design processes tends to emphasise the sophistication of the discerning human designer – it’s common to find that things easily achieved by hand are extremely difficult to automate with code.


TECHY BITS

Tweet Report is entirely generative and does not use any external graphics (apart from fonts). The bar charts are made using HTML DOM elements and the pie charts are rendered in SVG with some help from the D3.js. The Report uses Masonry to assist with transitioning the layout in response to changes in the browser width, and also makes extensive use of Kernit for the fine-grained kerning of heading text and the large numerals.


Links: http://gravitron.com.au/report | D3.js | Masonry.js | Kernit.js


Physics

Physics on first appearance would seem to be one of the most abstract representations amongst my collection of Twitter works, however, it is a fairly straightforward data visualisation with a few twists. The basic logic of representation is much like a graph. Each tweeter appears as a disc featuring their avatar pic, the size of which is determined by the number of tweets made by the tweeter. Complexity grows with the addition of time; the Twitter timeline is replayed as a time-lapse sequence with discs arriving in the order that the tweets were made. A further increase in complexity occurs with the inclusion of physics; new tweeters fall from the top of the browser and bounce amongst the existing pool of tweeters, the discs rotating and jostling for position. You can grab discs and hurl them about the browser, causing explosive collisions and rebounds. Clicking and holding a disc causes it to act like a magnet, attracting all of its associated retweets. And again, there is a satisfying eruption as the retweet discs bustle their way free from the pack to find their magnetic reference disc.

A short video screencast of Physics in use.

While it is certainly satisfying to smash different tweeters about the screen and feel the forces of gravity and momentum at work, the physics simulator does also fulfil a more pragmatic role within the piece. The issue with visualising a large set of differently sized objects, like our collection of tweeters, is how to organise them in an economical way within the confines of the display area. There is much research and literature dedicated to addressing organisational problems such as this but instead of following the stacking algorithms route I used the Box2D physics simulator as a layout engine. Not only can the physics simulator deal with the size and space issue, it also handles dynamic changes in the size and quantity of objects. For example, when changing from Tweets to Retweets, Box2D dynamically repositions all elements to accommodate their changing scale. Box2D is an impressive physics engine and it’s easy to appreciate why it is so widely employed in computer gaming.

physics nav
Changing scale from total tweets to retweets

Working with Box2D adds another layer of abstraction to what is already a fairly crowded context; the web “page” employs HTML to define objects, CSS to style the appearance of objects, Javascript to control the behaviour of objects, and Box2D to determine the positioning of objects. The Box2D engine makes no reference to browser windows or pages and is completely context-independent, working with its own virtual world and coordinates. To position objects on screen the Box2D coordinates need to be translated for the display context. In a web setting designers typically render a scene using the HTML canvas element but in the Physics piece I work directly with the HTML Document Object Model (DOM). Each of the discs is actually a <div> element with CSS border-radius converting the box into a circle. It’s remarkable how good the DOM rendering is, both with regards to frame rate and to image quality (obviously, the larger the browser window the slower the rendering, but sizes under 1200×900 the performance is pretty decent). When viewing the Physics piece on a high resolution Retina screen, all of the objects are rendered with startling clarity and precision. From a graphic design perspective, the combination of physics + DOM is another fascinating evolution of the web “page”.

Links: http://gravitron.com.au/physics | Javascript port of Box2d | jQuery Box 2D version | Stats.js