Desktop Magazine Interview

Desktop Magazine interviewed Mitchell Whitelaw and myself late in 2012 for their Dec/Jan issue. The theme of the issue was “the future” and our interview addressed the future of data-graphics / data-viz. It was fun to offer some thoughts and a real privilege to appear amongst the stellar list of contributors that editor Heath Killen assembled including Dan Hill, Casey Reas, Seb Chan, Stuart Candy, and Alexandra Daisy Ginsberg, among others. Danielle Neville wrote a great opener and the issue also featured some work from Patrick Stevenson-Keating, as well as fellow Canberran Paul Krix. Now that the dust has settled on the print version, the good folks at Desktop Magazine have published our interview on their website in two parts: Part one, and Part two.

Not long after its web publication Part two prompted an unequivocal rebuttal (via Twitter) from dataviz pro Ben Hosken of Flink Labs.


Twitter is not an ideal forum for in-depth exchange, but I believe that this was the offending statement from the interview:

Where are things headed in the immediate future for data visualisation?
GH: I predict data visualisation becoming a normal part of graphic design practice. Data viz cannot be considered a special case, something to be ignored or left to others to deal with. Data is a constant in our society and its significance is only increasing. It’ll take a bit of work for graphic designers to become completely comfortable with the practices of data representation but as they do I think we’ll see data being used more commonly and creatively – something that I look forward to.

I didn’t mean to underestimate what is involved in dataviz, particularly when dealing with large &/or complex datasets and creating dynamic interactive works (D3, Tableau, etc). My point was only that graphic designers will increasingly be expected to possess some data literacy – to have the ability to work with data and prepare engaging visual representations. The same thing happened with web design – it was initially treated as a curiosity by graphic designers and graphic design education but is today a staple of the graphic design profession and essential for graphic design graduates (IMHO). That is not to suggest that graphic design graduates need to be web dev experts, but only that they need a decent literacy in design for web. Ditto for dataviz. If nothing else, the exchange highlights the ambiguity of the term “dataviz”. It’s a huge domain with plenty of scope for contribution from a diversity of practitioners.

As well as some blue sky thinking on the future of data-graphics/viz the interview provides some context for the teaching and research that Mitchell, myself and our colleagues are conducting at the University of Canberra. If you’re interested, we have programs at all levels: Bachelors, Honours, Masters by coursework, Masters by research, and doctorate.

Links: Heath Killen interview | Flink Labs |
3D

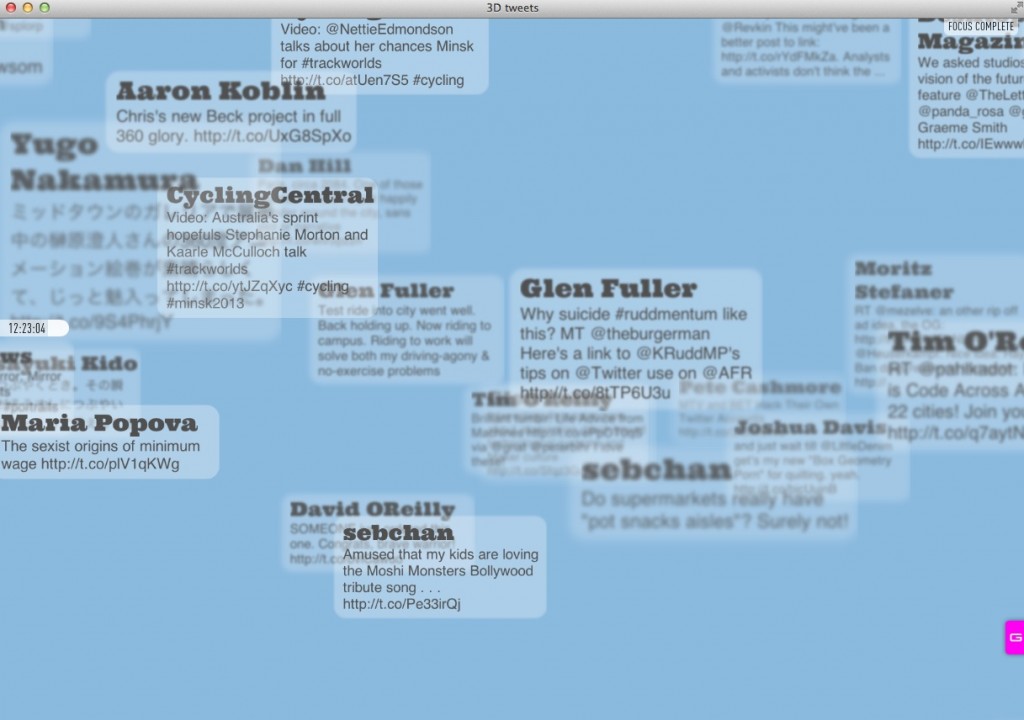
In this work, the tweet stream is represented in a virtual 3D space with older tweets in the far distance and more recent tweets in the near distance. While the piece has some practical logic governing its arrangement, its primary aim is one of affect, creating an atmosphere in which the viewer floats amongst their tweet stream. It is most effective at closer proximity, where the sense of scale and depth of field becomes exaggerated. It presents an ambient form of browsing where tweets are discovered by chance as they float into view. The overlapping and blurring of tweets gives a sense of a cacophony of voices rather than the tidy timeline that is the norm of Twitter clients.

3D tweets
Tweets in space

Double clicking on a tweet shifts the focus and zooms the view to its proximity. Double clicking in space resets the view. Single clicking a tweet highlights it and others by the author. Clicking the time marker on the left of the screen reveals a histogram of the tweet stream. Dragging the time marker to a new position changes the focal depth to the tweets within the chosen time band.

The main 3D effect (scaling and parallax scrolling) comes courtesy of CSS 3D transforms and the depth of field is achieved using CSS text-shadow and box-shadow. The fill of the text and boxes is transparent, their form being made entirely of the CSS shadow. The level of shadow is determined by the Z-depth of the element relative to the current focal depth. The CSS is along the lines of:

color: rgba(0,0,0,0); text-shadow: 0 0 2px rgba(0,0,0,0.75);

In the above CSS, the text’s color attribute is set to transparent. Its text-shadow has no x and y offset, 2 pixels of blur and the shadow’s colour is set to black (0,0,0) with transparency of 0.75.

Example: 1 pixel blur, 2 pixel blur, 3 pixel blur, 4 pixel blur.

While the rendering of the general 3D effect (scaling and parallax) is really impressive (even on mobile devices) re-rendering the blur of elements is much slower and there is a noticeable delay each time the depth of field is adjusted. There’s no denying that it’s a crude technique but until depth of field is included in CSS 3D transforms it serves as an easy hack for simulating depth of field for text and simple shapes. For a bit of comparison, here is an early sketch using Flash and the Papervision 3D library for rendering.

http://gravitron.com.au/3d/flash/sketch/3d.swf

The sketch uses a small sample of cached tweets (from some years back) and does not interact with the live Twitter API. Clicking a tweet once zooms to its proximity. Clicking the tweet a second time resets the zoom. Despite obvious differences between the Flash/Actionscript and html/css/js contexts, the Flash version works in a very similar way to the html native version. As with the css version, the depth of field blurring is based on the z-index of the element relative to the current focal depth. The obvious difference is that the focal depth is adjusted dynamically on the rollover of elements. This is an effect that is only possible in the css version with a very limited number of elements. The Flash sketch also slows with the addition of more elements but it manages pretty capably with the selection of tweets included.


SOFT INDUCTION

Within the CSS language there is increasing reference to properties of time and space in rules for 3D transforms, animation, and transitions. From a graphic design perspective it’s evidence of how design and layout concepts borrowed from print are evolving in response to the computational context. I say “computational context” rather than “screen” because the changes are about much more than a shift from dots to pixels. In addition to references to time and space there is also an increasing incidence of computational concepts and techniques. For example, CSS already has limited support for variables which allow programmatic assignment of values for colour, size, etc.

For some, like the creative code scene, the engagement with computation is explicit and sees designers employing programming languages like Java and C++ using tools like Processing and openFrameworks. But the evolution of CSS points to a more subtle permeation of computational concepts and techniques, and a softer induction of designers into computational/programmatic practices. For example, even a simple concept like using CSS media-queries for different device widths represents a form of programmatic design. And once familiar with elementary programmatic concepts a curious designer can scaffold to more sophisticated computational concepts and techniques, and fully featured programming languages. More simply, I’m describing a “top-down” rather than “bottom-up” approach to programming – designers developing programmatic techniques through familiar tools and technologies rather than approaching programming as a foreign language to learn.

At this juncture it’s very tempting to segue into a discussion of Minecraft, and how it manages to gently induct kids into a broad range of computer activities well outside the bounds of its virtual 3D world… But, instead I’ll save that for a separate spiel and leave this at that.

Links: http://gravitron.com.au/3d